By: Nathaniel Rozoff
Abstract:
Microglia, the resident macrophages of the CNS, can promote both MS and its remission due to their innate phagocytic properties. The GRIP1 protein influences the role of microglia in MS and is the focus of ongoing research to develop treatments for the disease. To enable future investigations, methods for GRIP1 suppression must be confirmed. This experiment examined whether or not one copy of the Cre promoter would be as effective as two copies of the Cre promoter at mediating GRIP1 expression through the Cre-ERT system. Using RNA isolation, RT reactions, and qPCR assays, researchers found that one copy of the Cre promoter was indeed as effective as two copies of the Cre promoter at inhibiting GRIP1 activity in mouse microglia. The researchers hope this work will enable future research regarding GRIP1’s role in inflammatory diseases.
Introduction:
Multiple Sclerosis (MS) is an immune disease that affects over 1.8 million people worldwide. Various forms of MS exist. Clinically Isolated Syndrome (CIS), characterized by early neurological symptoms, is often the first sign of MS. Relapsing-Remitting Multiple Sclerosis (RRMS) is the most common form of the disease and is characterized by periodic onsets of symptoms – relapses – followed by a period of remission in which patients experience little discomfort. Secondary Progressive Multiple Sclerosis (SPMS) can present after a patient has RRMS.
A patient with SPMS does not experience the same relapses and remissions that characterize RRMS – they are continuously affected by their symptoms. Finally, Primary Progressive Multiple Sclerosis (PPMS) entails a gradual progression of symptoms from the initial onset, with no clear relapses or remissions (World, 2023). Symptoms vary among patients; vision problems, difficulties with walking, balance, and processing information, weakness and stiffness in the arms and legs, depression, and fatigue are all common.
MS can affect anyone, but some demographic, genetic, and epigenetic factors correlate with instances of the disease. Demographically speaking, MS occurs 2 to 2.5 times more frequently in women compared to men. It also occurs most frequently in those of Northern European descent (Calabresi, P. A., 2011). In terms of genetics, relatives of MS patients have a significantly higher chance of developing the disease as opposed to members of the general population (Noseworthy, J. H., Lucchinetti, C., Rodriguez, M., & Weinshenker, B. G., 2000). Epigenetic factors include smoking, obesity, life at lower latitudes, Vitamin D deficiency, and infections like Eppstein-Barr Virus (Ascherio, A., & Munger, K., 2008) (Ascherio et. al, 2015).
The specific pathogenesis of MS is unknown and is the subject of significant ongoing research. Generally, researchers understand that the degradation of the myelin layer around nerve fibers causes the symptoms of MS (Multiple Sclerosis (MS), 2023). Myelin, made of proteins and lipids, insulates nerve fibers like insulation around electrical wires. When the myelin layer, known as the myelin sheath, is damaged, electrical impulses that travel through the nerve fibers slow or even cease (Myelin: MedlinePlus Medical Encyclopedia, 2020). This disruption of neural signals causes the symptoms of multiple sclerosis and other neurological diseases.
Research by the International Multiple Sclerosis Genetics Consortium surveying the entire human genome identified 200 gene variants linked with MS predisposition. The vast majority of the allele variants it identified were in genes involved in the immune response, suggesting that the immune system is centrally involved in MS pathogenesis and that immune cells are the cells damaging the myelin sheath (International Multiple Sclerosis Genetics Consortium et. al, 2011).
The domain of MS development is the Central Nervous System (CNS). However, many types of immune cells, like microglia and macrophages, play a role in the pathogenesis of the disease. CD4+T-cells, CD8+ T-cells, B-cells, antibodies, and other cells in the adaptive immune response all have proven links to MS development (Rodríguez Murúa, S., Farez, M. F., & Quintana, F. J., 2022). But, cells in the innate immune response play an even greater role (Hemmer et al., 2015). Mast cells open the Blood-Brain Barrier, allowing other immune cells to enter the CNS, and release promoters for neurodegeneration. Astrocytes promote MS pathogenesis through interactions with cytokines and chemokines (immune signalers) that prompt the involvement of other immune cells. Natural killers, in contrast, actually seem to mediate MS and are found at lower levels in MS patients. Specifically how natural killer cells do this is unknown, but certain signalers they release have been found to induce T-cell apoptosis, which may contribute to their mediating effect. Macrophages and their CNS resident form, microglia, are the most important type of cells in the innate immune response related to MS. They play a varied role in MS pathogenesis, with different states of activation leading the cells to contribute to the development of the disease through signaling and phagocytosis or to clear debris in the CNS and promote remyelination (Rodríguez Murúa, S. et al., 2022).
The potential of macrophages and microglia to be both agents of MS and promoters of remyelination is why they are a key focus of study in the context of the disease. GRIP1, also known as Glucocorticoid Receptor Interacting Protein 1, is a key factor in the dual functions of microglia in MS and MS models. The protein is a transcriptional coregulator in the immune system that mediates cytokine repression by glucocorticoids (Yurii Chinenov et al., 2012). It also plays a role in macrophage polarization and development – regulating the homeostasis of the immune system (Coppo et al., 2016).
Research suggests that GRIP1 has both positive and negative effects on MS pathogenesis. Mice in the EAE MS model with the GRIP1 gene knocked out experienced less severe symptoms of the disease, with decreased levels of demyelination, less infiltration of the nervous system by immune cells, and reduced microglial activation. However, GRIP1 suppression also reduced the therapeutic effects of treatments for the disease (Mimouna et al., 2020).
The papers in the preceding paragraphs are works of research of the Rogatsky Lab at the HSS Research Institute, where this investigation took place. The lab has advanced the understanding of MS and the role of genes like GRIP1 over many years of work, but questions remain. GRIP1 research is ongoing. To enable future research, inhibition methods for GRIP1 in research mice need to be verified.
The Rogatsky Lab uses a Cre promoter on the CX3CR1 gene to suppress GRIP1 expression in mice. This promoter takes the place of the normal CX3CR1 promoter and works like a set of genetic scissors, splicing sites, and genes marked by lox-p markers out of the genome (Kim et al., 2018). The CX3CR1 gene is involved in mice immunoregulation. Its function does not have relevance to this experiment, but the gene is activated regularly during normal homeostatic activity in the immune system – which is important for the removal of GRIP1. This process can be taken a step further through Cre-ERT, where the Cre promoter can only function after the mouse receives a Tamoxifen injection. The Cre-ERT process allows gene suppression to be induced at specific times for an experiment (Donocoff, R.S. et al., 2020).
This experiment examined whether or not one copy of the Cre promoter (a Cre promoter on only one of the two CX3CR1 alleles) would be as effective as two copies of the Cre promoter (on both of the CX3CR1 alleles) at reducing GRIP1 expression. The lab prefers to run experiments with only one copy of the Cre promoter so that the effects of CX3CR1 suppression do not skew results. It was hypothesized that one copy of the Cre promoter would be as effective as two copies of the Cre promoter at inhibiting GRIP1 expression.
Methods:
Mouse Prep
This experiment used a total of 18 mice (9 males and 9 females) born during October and November of 2022 at the HSS Research Institute. The mice were split into tw experimental groups and one control group based on their specific genotypes. One experimental group had mice with the Cre promoter on both CX3CR1 alleles, while the other had mice with the Cre promoter on only one CX3CR1 allele. Mice in both of these groups received Tamoxifen to trigger the Cre-ERT process. The mice in the control group had the Cre promoter on both alleles but were not given Tamoxifen. Three mice were selected for each group from each sex.
Members of the Rogatsky Lab began experimental work in late April of 2023 and conducted all research in the shared facilities of the HSS Research Institute. First, they gave injections of Tamoxifen in corn oil solution to the experimental group mice and injections of simple corn oil to the control group mice. Each injection was 150 uL and contained 3mg of Tamoxifen for the experimental group mice. These injections were given daily for the first four days of the experiment. The researchers euthanized the mice on the seventh day of the experiment, when Cre activity was high and GRIP1 expression was suppressed, before isolating the spleen and spinal cord cells. Tissues from these organs were digested and frozen at -80℃.
RNA Isolation
RNA Isolation was the foundation of this experiment. To measure GRIP1 expression, its RNA had to be isolated from each sample. RNA isolation was done with a QIAGEN RNeasy Mini kit and along a protocol outlined in their handbook (with slight modifications). First, the frozen tissue samples were thawed in a water bath before they underwent a PBS wash and centrifugation process to remove their storage media. Cells in the tissue samples were subsequently lysed with RLT buffer.
Afterward, each sample was homogenized with a 20-gauge needle. Ethanol was then added to each sample before they were spun in RNeasy spin columns. RW1 Buffer and RPE buffer were added before further spins. Finally, the RNA was eluted from the spin columns with RNAse-free water.
To accurately calculate solution solution ratios for the RT reaction to follow, each sample had its amount of RNA quantified using a Nanodrop Spectrophotometer. Any quantity of at least 60ng/uL was acceptable to use in the subsequent RT reaction. All samples from the spleen successfully passed the threshold, although all spinal cord samples had to be removed to do poor RNA yields.
Reverse Transcription
The RT reaction transcribed RNA back into cDNA. For each sample, ½ uG of RNA was needed. This was diluted to create a solution of 10uL with Nuclease-free water. 6uL of a mix of dNTPs and dN9 were then added to each sample. After the sample tubes were placed into a PCR machine correctly calibrated for the reaction, the RT reaction began. At a middle step in which the samples stayed at 4℃, 4uL of a second mixture of RT Buffer, RNAsin, the reverse transcriptase M-MuLV, and Nuclease-free water was added to each sample. The samples remained stored at 4℃ – before qPCR analysis.
qPCR
The process of qPCR quantified the amount of GRIP1 in the samples. First, the cDNA previously made during the RT reaction was diluted with Nuclease-free water. Then, a reaction master mix with SYBR Green and gene-dependent primer was created and aliquoted into the qPCR plate, before the cDNA of each sample was also aliquoted into theplate. The two genes quantified were the gene of interest, GRIP1, and a baseline gene, Actin. Each sample was run with two replicates for each of the two genes quantified. The qPCR reaction was executed in a QuantStudio 96-well machine. After data was collected from the machine, it was analyzed independently – as will be explained below.
Data Analysis
The research used the Livak method of relative quantification for data analysis. GRIP1 expression was compared to the expression of the baseline Actin. First, CQ values for each sample were averaged from the two replicates. Then, the ΔCQ values were calculated for each sample, using their CQ for Actin subtracted from their CQ from GRIP1. ΔCQ values were then averaged for the control group samples (GRIP +/+, without Tamoxifen). After, ΔΔCQ values were calculated, subtracting ΔCQ values of the control group from the ΔCQ values of the treatment group. Finally, expression ratios describing the relative expression of GRIP1 in each sample were calculated. The control samples had an expression ratio of 1, and every other sample was a decimal relative to that. Expression ratios were calculated by setting 2 to the power of the – ΔΔCQ for each sample. After this, the data were analyzed, graphed, and examined with standard deviation, T-tests, and Kruskal-Wallis tests.
Results:
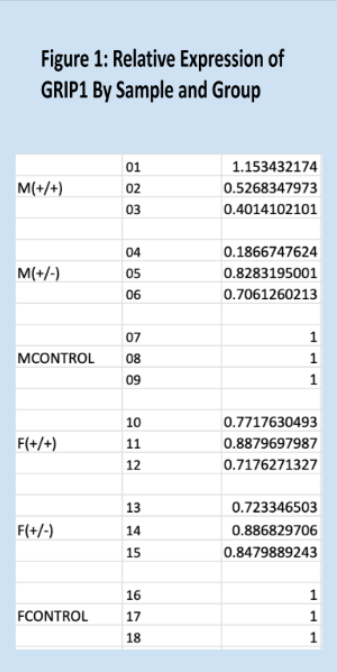
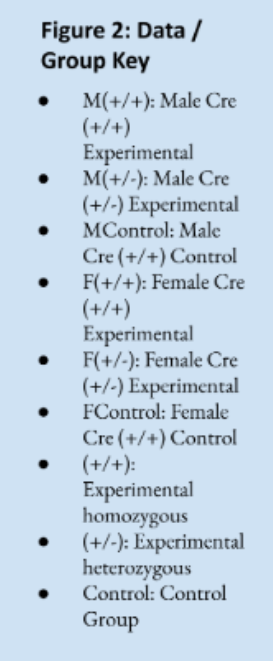
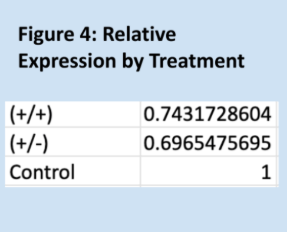
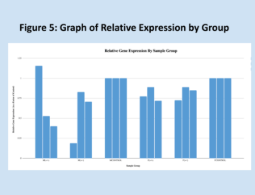
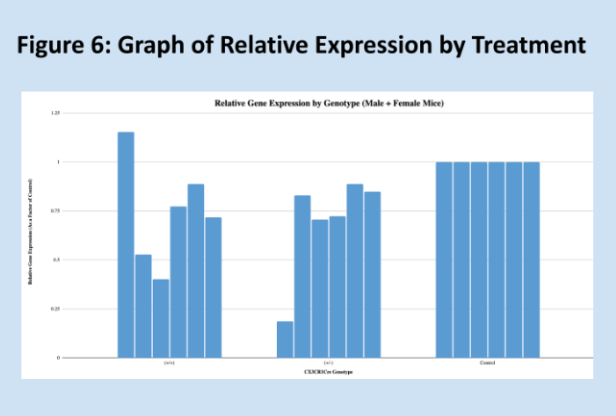
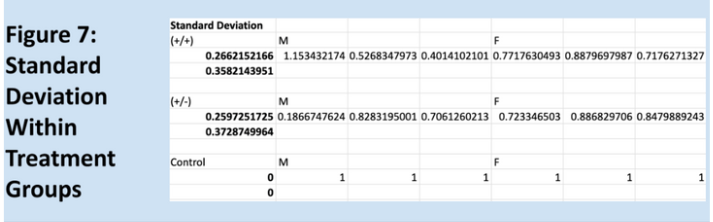
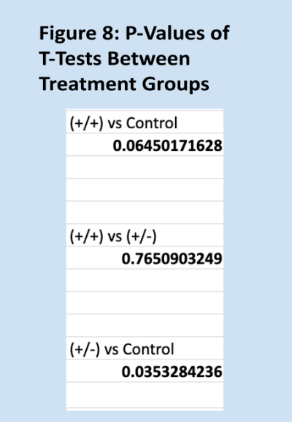
Relative expressions of the GRIP1 gene, as quantified through the Livak method, are shown below in Figure 1. Means for each group are shown in Figure 3, and Figure 2 is a key to the labels used for the data. Figure 7 shows the standard deviations within each treatment group. As expected, the relative of the homozygous and heterozygous experimental groups are very similar, 0.74 and 0.70, respectively. The control group has a mean relative expression of exactly 1, expected since relative expressions for experimental samples were calculated relative to these values. The relatively large coefficients of variation for both experimental groups raise some concerns about the reliability of the data. However, the T-test results and Kruskal-Wallis test results largely align with the experiment’s hypothesis – suggesting that one copy of Cre is as effective as two copies of Cre at impairing GRIP1 activity. It should be noted that the difference between the homozygous experimental group and the control group is not significant, but trending very close to significance.
A principal error in the design of this experiment was the small sample size. This was due both to the limitations of experimental resources and the nature of this research. Mice with the correct genotype needed to be used for breeding and future research, and must be used efficiently according to Cornell’s policy of 3Rs for animal use. Furthermore, this experiment was intended to confirm a method of GRIP1 suppression for future experiments, not establish novel protocols. 18 mice, in the context of this research, is a lot, but 18 samples are not. Some samples in each of the male experimental groups appear to be outliers. This may be attributed to how Tamoxifen, used in the Cre-ERT process, interacts with estrogen receptors. This interaction varies slightly between male and female mice but is not believed to have been a meaningful error in the experiment. The three samples in each group, when broken down by treatment and sample sex, are typically insufficient for meaningful research, but were deemed satisfactory due to the constraints and purpose of the experiment. This small sample size probably led to the large coefficients of variation for the experimental groups and the surprising lack of a significant difference between the homozygous experimental group and the control group. Once again, the lack of significant difference between the two experimental groups, the large significant difference between the heterozygous experimental group and the control group, and the trend towards significance of the aforementioned difference between the homozygous experimental group and the control group, all support the conclusions of this experiment.
This experiment validates the Cre-ERT GRIP1 knockout method as effective for future studies. The researchers hope that this work will enable future research regarding GRIP1’s role in inflammatory diseases, and help further scientific endeavors in general.
Literature Cited:
Ascherio, A., & Munger, K. (2008). Epidemiology of multiple sclerosis: from risk factors to prevention. Seminars in neurology, 28(1), 17–28. https://doi.org/10.1055/s-2007-1019126
Ascherio, A., Munger, K. L., White, R., Köchert, K., Simon, K. C., Polman, C. H., Freedman, M. S., Hartung, H. P., Miller, D. H., Montalbán, X., Edan, G., Barkhof, F., Pleimes, D., Radü, E. W., Sandbrink, R., Kappos, L., & Pohl, C. (2014). Vitamin D as an early predictor of multiple sclerosis activity and progression. JAMA neurology, 71(3), 306–314.
https://doi.org/10.1001/jamaneurol.2013.5993
Bates College Department of Biology. (2014). How to Write a Paper in Scientific Journal Style and Format https://www.bates.edu/biology/files/2010/06/How-to-Write-Guide-v10-2014.pdf
Calabresi, P. A. (2011). Multiple Sclerosis and Demyelinating Conditions of the Central Nervous System. In Goldman’s Cecil Medicine: Twenty Fourth Edition (Vol. 2, pp. 2347-2355). Elsevier Inc.. https://doi.org/10.1016/B978-1-4377-1604-7.00419-X
Coppo, M., Yurii Chinenov, Sacta, M. A., & Rogatsky, I. (2016). The transcriptional coregulator GRIP1 controls macrophage polarization and metabolic homeostasis. Nature Communications, 7(1). https://doi.org/10.1038/ncomms12254
Dendrou, C. A., Fugger, L., & Friese, M. A. (2015). Immunopathology of multiple sclerosis. Nature reviews. Immunology, 15(9), 545–558. https://doi.org/10.1038/nri3871
Donocoff, R.S., Teteloshvili, N., Chung, H. et al. Optimization of tamoxifen-induced Cre activity and its effect on immune cell populations. Sci Rep 10, 15244 (2020).
https://doi.org/10.1038/s41598-020-72179-0
Hemmer, B., Kerschensteiner, M., & Korn, T. (2015). Role of the innate and adaptive immune responses in the course of multiple sclerosis. Lancet Neurology, 14(4), 406–419. https://doi.org/10.1016/s1474-4422(14)70305-9
Immunology for Non-Immunologists: Innate vs. Adaptive Immunity | Charles River. (2019, March 7). Charles River.
https://www.criver.com/eureka/immunology-non-immunologists-innate-vs-adaptive-immunity#: ~:text=While%20innate%20immunity%20mounts%20a,immunity%20responds%20to%20specif ic%20antigens.
International Multiple Sclerosis Genetics Consortium, Wellcome Trust Case Control Consortium 2, Sawcer, S., Hellenthal, G., Pirinen, M., Spencer, C. C., Patsopoulos, N. A., Moutsianas, L., Dilthey, A., Su, Z., Freeman, C., Hunt, S. E., Edkins, S., Gray, E., Booth, D. R., Potter, S. C., Goris, A., Band, G., Oturai, A. B., Strange, A., … Compston, A. (2011). Genetic risk and a primary role for cell-mediated immune mechanisms in multiple sclerosis. Nature, 476(7359), 214–219. https://doi.org/10.1038/nature10251
Kim, H., Kim, M., Im, S.-K., & Fang, S. (2018). Mouse Cre-LoxP system: general principles to determine tissue-specific roles of target genes. Laboratory Animal Research, 34(4), 147. https://doi.org/10.5625/lar.2018.34.4.147
Macrophages | British Society for Immunology. (2021). Immunology.org. https://www.immunology.org/public-information/bitesized-immunology/cells/macrophages
Macrophages: What Are They, Different Types, Function, and More | Osmosis. (2019). Osmosis. https://www.osmosis.org/answers/macrophages
Mimouna, S., Rollins, D. A., Shibu, G., Tharmalingam, B., Deochand, D. K., Chen, X., Oliver, D., Chinenov, Y., & Rogatsky, I. (2020). Transcription cofactor GRIP1 differentially affects myeloid cell–driven neuroinflammation and response to IFN-β therapy. Journal of Experimental Medicine, 218(1). https://doi.org/10.1084/jem.20192386
Multiple Sclerosis (MS). (2023). Hopkinsmedicine.org.
https://www.hopkinsmedicine.org/health/conditions-and-diseases/multiple-sclerosis-ms
Myelin: MedlinePlus Medical Encyclopedia. (2020). Medlineplus.gov.
https://medlineplus.gov/ency/article/002261.htm#:~:text=Myelin%20is%20an%20insulating%20 layer,efficiently%20along%20the%20nerve%20cells.
Noseworthy, J. H., Lucchinetti, C., Rodriguez, M., & Weinshenker, B. G. (2000). Multiple sclerosis. The New England journal of medicine, 343(13), 938–952.
https://doi.org/10.1056/NEJM200009283431307
Promoter. (2023). Genome.gov. https://www.genome.gov/genetics-glossary/Promoter
Rodríguez Murúa, S., Farez, M. F., & Quintana, F. J. (2022). The Immune Response in Multiple Sclerosis. Annual review of pathology, 17, 121–139.
https://doi.org/10.1146/annurev-pathol-052920-040318
World. (2023, August 7). Multiple sclerosis. Who.int; World Health Organization: WHO. https://www.who.int/news-room/fact-sheets/detail/multiple-sclerosis
Yurii Chinenov, Gupte, R., Dobrovolná, J., Flammer, J. R., Liu, B., Michelassi, F., & Rogatsky, I. (2012). Role of transcriptional coregulator GRIP1 in the anti-inflammatory actions of glucocorticoids. Proceedings of the National Academy of Sciences of the United States of America, 109(29), 11776–11781. https://doi.org/10.1073/pnas.1206059109


Leave a comment