By: Dahlia Zemmel
Abstract:
Polyethylene terephthalate (PET) plastic is one of the most commonly used types of plastic. It is a semicrystalline polymer that may degrade into smaller pieces when heated above its glass transition temperature. The effects of nanoplastics on the environment and human health are understudied because experiments often use engineered nanoparticles instead of actual nanoplastics as they would occur in nature. The purpose of this experiment was to measure the effect of temperature on the size and amount of particles formed in PET degradation. Another purpose of this lab was to determine if Sodium Lauryl Sulfate (a common cleaning surfactant) is an effective means of particle suspension. The experiment studied samples held for 26 days (starting at day 0). It found that after day 14 PET held at 110 C degrades into nanoplastics with the most common size of 70nm. The experiment also found that SLS was an effective means of particle suspension. The results of this experiment could be important in the future field of nanoplastic research because the procedure provides an effective and reproducible method to create a stock nanoplastic solution.
Introduction:
Polyethylene terephthalate (PET) plastic is one of the most commonly used types of plastic. Plastic water bottles, containers, and packaging are typically made from PET. Over 82 metric tons of PET are produced each year to make single use plastics. (“Researchers Engineer Microorganisms to Tackle PET Plastic Pollution” 2021) PET is not a biodegradable plastic, thus it causes an excess of waste in the environment. (Hiraga et al. 2019) In theory, degradation of PET would reduce waste built up in landfills and be better for the environment. However, it is important to consider all the environmental effects of plastic degradation.
Nanoplastics and microplastics form from larger pieces of plastics degrading. Nanoplastics are polymers with dimensions ranging from 1 nm to 1 μm. Because of their size, the effects of nanoplastics on human health and the environment are an area with minimal research. One study found that nanoplastics consumed by fish were able to penetrate their blood-to-brain barrier leading to behavioral disorders.(Mattsson et al. 2017) Similar studies have found that nanoplastics have the potential to penetrate biological systems like the intestinal barrier, blood-air barrier, and the placental barrier. (Lai, Liu, and Qu 2022) Humans are exposed to nanoplastics throughout almost their entire life. (Lai, Liu, and Qu 2022) The use of plastics in pipe construction, air pollution, wearing out car tires, touching or using skin products with nanoplastics, or consuming animals that previously consumed plastics are examples of ways nanoplastics are absorbed into the human body. (Lai, Liu, and Qu 2022) It is important to note, however, that the extent of the impact of nanoplastics on human health is unclear. This is because of the difficulty to standardize an experimental procedure using nanoplastics (Maxine Swee-Li Yee et al. 2021).
One major issue in plastic research is the use of chemically engineered nanoparticles instead of nanoplastics. Some studies use nanoparticles which are engineered to a certain size unlike nanoplastics which are degraded from larger plastics. (Sharma et al. 2022) One issue with the use of nanoparticles is that they are engineered to fit a smaller size range than nanoplastics actually occur in nature. Nanoparticles range from 1-100 nm whereas nanoplastics can be as large as 1µm. (Sharma et al. 2022). Nanoplastics are polydisperse (varied in particle size and surface properties) whereas nanoparticles are constructed to be more homogenous (uniform throughout). Because nanoplastics form by degradation of larger plastics there is little data on the amount of nanoplastics that exist. Because of the amount of plastic waste in the world (320 million tons per year (“The Mobility of Plastic Nanoparticles in Aqueous and Soil Environments: A Critical Review” 2021)), it is likely that there are not enough engineered nanoparticles to accurately simulate the effects of nanoplastics on humans. (Sharma et al. 2022) One study on the mobility of nanoplastics through different types of natural solutions was conducted using nanoparticles. (“The Mobility of Plastic Nanoparticles in Aqueous and Soil Environments: A Critical Review” 2021) Another study drawing conclusions on how nanoplastics move through the human gut was conducted using nanoparticles instead of nanoplastics. (Maxine Swee-Li Yee et al. 2021) Both studies, however, recognized the importance of researching nanoplastics as they occur in nature in order to fully understand their impact on the environment and human health.
Without fully understanding the effects of nanoplastics it is crucial to be wary when considering degradable plastics as more environmentally friendly than other plastics.
PET plastic is a semicrystalline polymer. A polymer is a long chain of repeating units (monomers). The monomers that form PET are terephthalic acid and ethylene glycol.(Gomollón-Bel 2017) A semicrystalline polymer is a macromolecule in which the polymer chains exist in both semi crystalline and amorphous regions.
The semi crystalline regions are made of ordered polymer chains folded on top of one another called lamella. Lamella are connected by disorder and tangled polymer chains called amorphous regions. A polymer’s degree of crystallinity is determined by how orderly its monomer chains are aligned. The more crystalline the polymer, the more orderly its chains are aligned.(“Crystallinity” 2024)
An important concept in polymer research is a polymer’s glass transition temperature (Tg). The glass transition temperature is the point where the thermal energy is large enough to break the intermolecular forces in the polymer. (Paul 2020) Since crystalline structures have strong intermolecular forces, the greater amount of order in a polymer leads to a stronger overall structure that takes lots of energy to break. Thus, the higher a polymer’s Tg, the higher the degree of crystallinity. Polymers have different physical properties above and below Tg. Below Tg polymer chains are hard and brittle. This is because PET is amorphous and highly disordered.
Above Tg, disordered and entangled polymer chains in the amorphous region begin to unfold and straighten out, creating a more ordered structure. This makes the polymer softer and more malleable. The process of heating a semi-crystalline polymer above its Tg is known as “Thermal Crystallization”. (Demirel, Yaraș, and Elçiçek 2011) Thermal crystallization allows the polymer to transition from amorphous to semi-crystalline.
Above the glass transition temperature, each polymer also has a melting temperature (Tm). The melting temperature is the point where a polymer changes from a rubbery state to a liquid state. PET has a Tg between 340 to 353 K (67 to 80 °C) and a Tm of 540 K (267 °C). (Demirel, Yaraș, and Elçiçek 2011) This experiment used PET at temperatures of 100 C and 110 C because they are between the glass transition temperature and melting temperature. In theory higher temperatures would result in faster degradation of PET, however, this experiment was limited to a range around the boiling point of water. If the PET was kept at temperatures too far above the boiling point of water there would be a risk of explosion.
This experiment also measured the effectiveness of SLS for particle suspension. SLS or Sodium Lauryl Sulfate is a surfactant commonly used in cleaning products. It has an anionic head which is soluble in water and a 12-carbon long hydrophobic tail. (“Sodium Lauryl Sulfate – Molecule of the Month – March 2010 – HTML-Only Version” 2024) SLS lowers the surface tension of liquid in solution. Since PET is hydrophobic and more dense than water it does not dissolve in solution, rather it settles to the bottom. The hydrophobic tails of SLS solvate the PET and suspend it in solution. (“Sodium Lauryl Sulfate – Molecule of the Month – March 2010 – HTML-Only Version” 2024) Since SLS also has an anionic region, there are small repulsions between PET particles in solution keeping small PET particles from aggregating.
The purpose of this experiment was to measure the effect of temperature on the size and amount of particles formed in PET degradation. Another purpose of this lab was to determine if SLS is an effective means of particle suspension.
Methods:
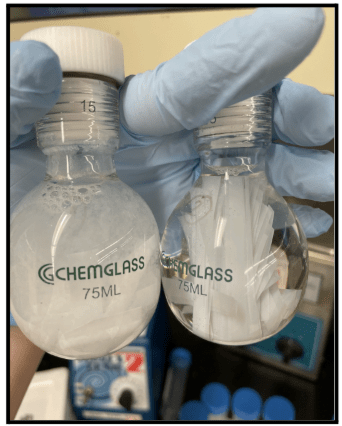
Lab-grade amorphous PET was crystalized by thermal crystallization. It was heated in an oven at a temperature of 120 C. Once cooled, five grams of plastic were massed on a precision scale with a box around it to prevent airflow. That PET was then cut into thin strips using scissors. The strips needed to be thin enough to fit into and rest on the bottom of rounded high pressure vials. Then, 50 mL of HPLC water was pipetted into the vial. This created a concentration of .1g/mL. (See image 1.1) Then the sample was run through the DLS machine. (See DLS procedure) This vial was labeled vial 1. The process was repeated for another vial and labeled vial 2. Two oil baths were heated, one to 110 C and the other to 100 C. (See Image 1.2) Vial 1 was placed in the 110 C bath and vial 2 was placed in the 100 C. These samples were left for 24 hours. Every two days the vials were removed from the oil baths, placed to cool in an ice bath for around 10 minutes (see Image 1.3) and then run through the DLS procedure.
Dynamic light scattering (DLS) is a technique for measuring the size and count rate of particles in a solution. A DLS machine shoots a laser through a sample solution. The particles in that solution reflect and scatter that light onto a photon detector. (Basel 2022) Count rate is the signal strength of the scattered light measured in photons kilo-counts per second.(Ulf Nobbmann 2015) Most DLS machines can analyze particles between 0.3nm and 10µm (“Dynamic Light Scattering: DLS Particle Analyzer :: Microtrac” 2024) The DLS machine makes calculations based on the Brownian motion of particles to determine particle size distributions. Brownian motion is the random movement of suspended particles in a solution. (“2.1: Brownian Motion: Evidence for Atoms” 2017) The rate of Brownian motion is represented by the Translational Diffusion Coefficient (D). Smaller particles have a higher D than larger particles. The DLS machine uses D to determine the hydrodynamic diameter of a particle. The hydrodynamic diameter (dh) is “the diameter of a perfect sphere that would exhibit the same hydrodynamic friction as the molecule of interest.”(“How Is the Hydrodynamic Diameter Defined? – Dynamic Biosensors” 2018) Hydrodynamic diameter is an estimation of particle size. When the DLS machine shoots the laser through the solution, the particles move. Thus, the intensity of light reflected back onto the detector changes over time as the particles diffuse. (Malvern Panalytical 2019) An autocorrelation function of intensity over time is determined to find the D. An autocorrelation function is essentially a comparison of snapshots of intensity measurements taken over time (within milliseconds) and compared back to the original intensity measurement (there is little change). (Malvern Panalytical 2019) Eventually, the intensity completely changes and there is no correlation between that and the original. A nonlinear least squares model (mathematical model used to find a curve of best fit) is determined based on the autocorrelation function. This gives the value of D. (“DLS” 2023) The diffusion coefficient is used in the Stokes-Einstein equation to determine dh (the hydrodynamic diameter). The Stokes-Einstein equation is: dh = kT/3ηD (dh = hydrodynamic diameter, k = boltzmann’s constant, T = temperature, η = viscosity, D = translational diffusion coefficient) (Malvern Panalytical 2019). This equation can be manipulated to give intensity, size, and number distributions.
Size Distributions:
Three types of size distributions were calculated in this experiment: Number size distributions, volume size distributions, and intensity size distributions.
Note: Na represents the number of particles with size a and Nb represents the number of particles with size b.
Number Distribution Equation:
%Na = (100×Na)/(Na + NB)
The percent of particles with size a is equal to 100 times the number of particles with size a divided by the total number of particles or number of size a + number of size b.
Volume Distribution Equation:
%Va = (100×Naa3)/(Naa3×Nbb3)
The percent volume of particles with size a is equal to 100 times the number of particles with size a times the volume of a. That is divided by the total volume of particles. Even if large particles are few in number, they are represented in the volume distribution. Say size a, for example, is
very large but there are very few particles of size a. The number of particles with size a is being multiplied by a very large number (a3).
Intensity Distribution Equation:
%Ia = (100×Naa6)/(Naa6×Nbb6)
The percent intensity of particles with size a is equal to 100 times the number of particles with size a times the volume squared of a. That is divided by the total volume squared of particles. Intensity distributions represent large particles even more than volume distributions. This is because the number of particles of a certain size are multiplied by that size to the sixth power, rather than that size to the third power.
DLS procedure:
400 microliters were pipetted from vial 1 into a cuvette. The cuvette was vortexed for approximately one minute. Then, the cuvette was run through the DLS machine. Once the DLS machine completed its run, the solution in the cuvette was poured back into the vial in order to complete the concentration of PET to water constant. The same process was repeated for vial 2. (See Image 1.4)
Electron Microscopy:
Both SEM (Scanning Electron Microscope) and TEM (Transition electron microscope) were used to take images of the freeze dried sample of PET in water. There are many differences between SEM and TEM microscopy. TEM allows for more information about the physical properties of the sample like crystal properties and morphology. While TEM only produces 2D images of the sample, SEM produces 3D images (“Electron Microscopy | TEM vs SEM | Thermo Fisher Scientific – NZ” 2020). The process of preparing samples for SEM microscopy is relatively simple: in this experiment, the sample was pipetted onto aluminum wafers and freeze dried. The process of preparing samples for TEM is more complex. Samples must be very thin (typically less than 150 nm) and one must also insure that no outside precipitates enter the sample. In this experiment serial dilutions of SLS and nanoplastics were made and 10 μL were dropped onto a formvar/carbon TEM grid. The grid was then left to evaporate completely before imaging in the TEM.
Image 1.1:
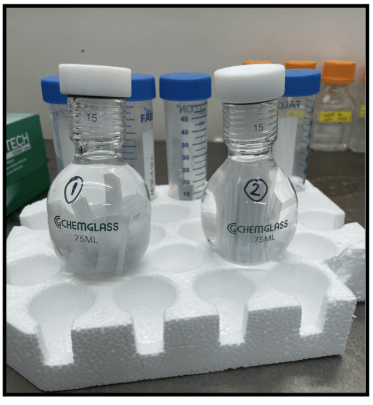
Vial 1 and Vial 2 experimental setup
Image 1.2:
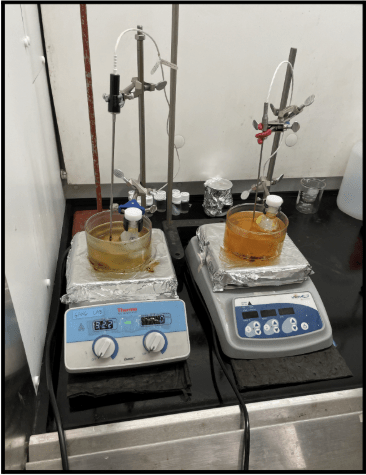
Storing and heating methods for vials at each temperature
Image 1.3:
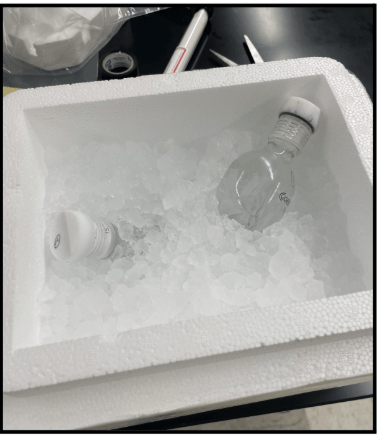
Cooling method for Vial 1 and Vial 2
Image 1.4:
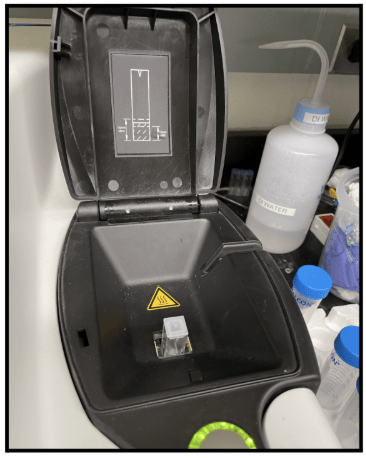
Cuvette in DLS Machine
Image 2:
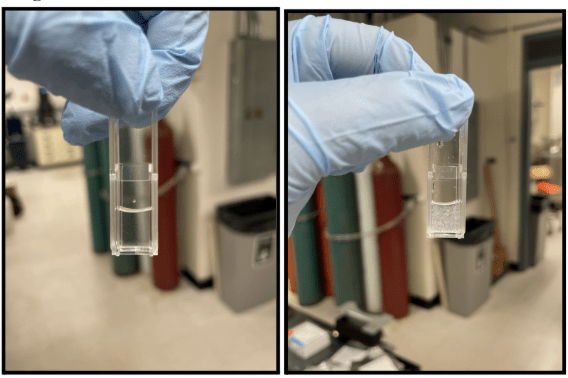
Vial 1 (110 C) Day 5 and Vial 1 (110 C) Day 9
Image 3:
Day 9: 110 C (left) 100 C (right)
Results: (See data tables in Appendix A)
Image 4: Images of Freeze Dried Sample in SLS under SEM microscope
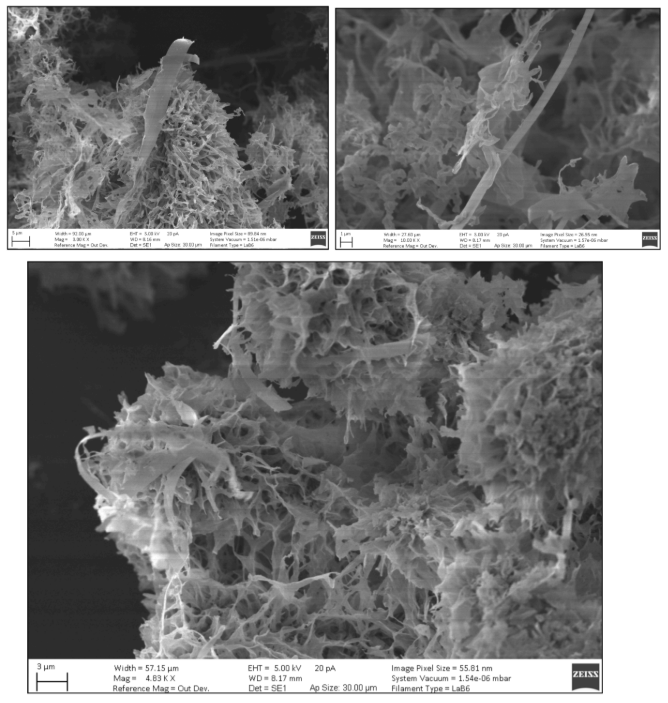
Images taken by SEM of freeze dried samples of PET in SLS solution.
Image 5: Images of Freeze Dried Sample in SLS under TEM microscope
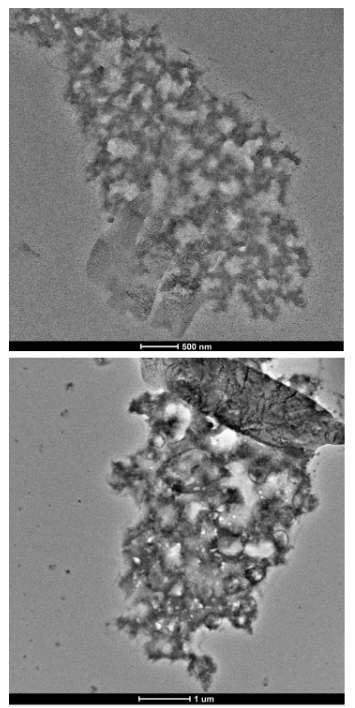
Images taken by TEM of freeze dried samples of PET in SLS solution.
Discussion:
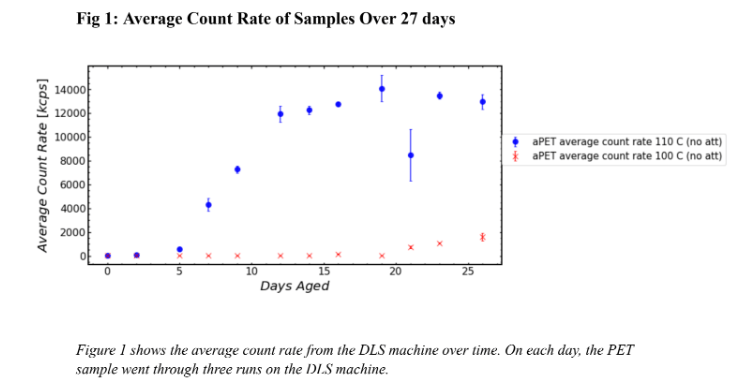
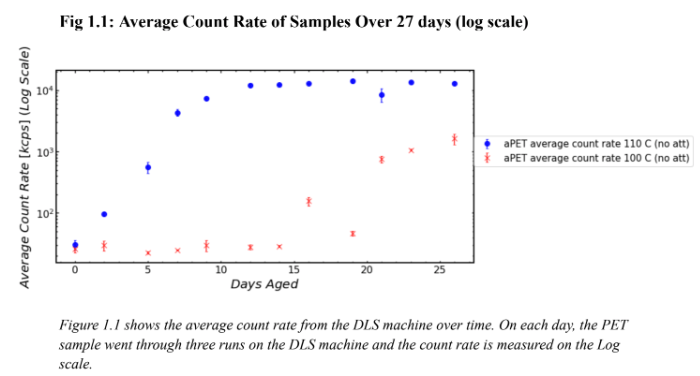
Figure 1 shows the average count rate of particles in PET samples held at two different temperatures for 26 days. Figure 1 should be used to determine when each sample began degradation and Figure 1.1 should be used to determine how many orders of magnitude higher one sample’s count rate was than the others. This is because Figure 1 uses a numerical scale for count rate and Figure 1.1 uses a log scale. Figure 1 shows that the sample held at 110 C began degradation earlier than the sample held at 100 C. Figure 1 shows that the PET held at 110 C began degradation on day 5 because there is a jump in the count rate whereas the PET held at 100 C began degradation between day 15 and 22. As shown on Figure 1.1, by day 5, the count rate for the PET held at 110 C is two orders of magnitude higher than the count rate for the sample held at 100 C. After around 15 days at 110 C, the degradation of the sample began to level out around 104 kcps. As shown by its large error bars, there is an outlier in the sample held at 110 C on Day 21. This was likely due to human error in the pitpetting portion of the experimental procedure thus improperly preparing the sample to be run through the DLS machine. Figures 1 and 1.1 show that the sample held at 110 C degraded at a much faster rate than the sample held at 100 C. A visual representation of this degradation is shown in Image 3. On day 9, the vial containing the sample held at 110 C was completely opaque whereas the vial containing the sample held at 100 C was transparent. The reaction between HPLC water and PET was constantly occurring, however, that reaction caused the sample held at 110 C to degrade much faster than the sample held at 100 C.
A major source of error in this experiment was PET settling over time. The vials shown in Image 2 were the ones run through the DLS machine. Image 2 shows the higher concentration of PET in the vial run through the DLS machine on day 9 than on day 5. Since PET is more dense than water, the particles would sink to the bottom and the DLS machine would not get an accurate reading of the count rate. To combat this the volume of liquid in the vial run through the DLS machine was doubled on day 14. The double volume allowed for an accurate DLS reading even if the particles settled because they would still settle higher than where the laser reached.
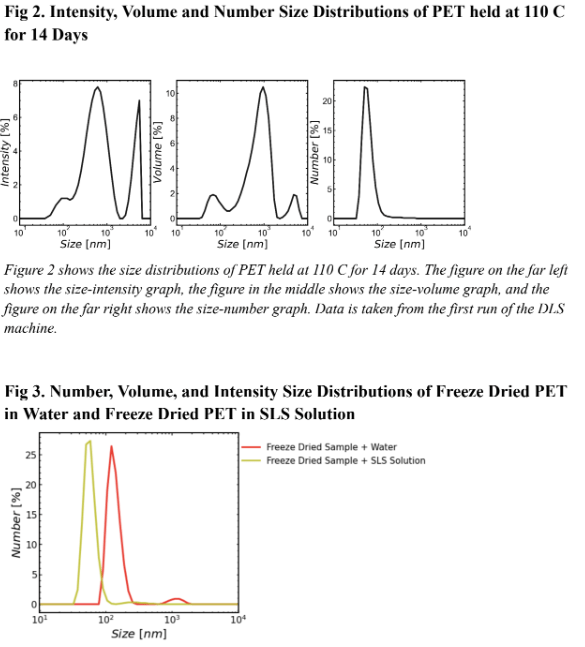
Figure 2 Shows the size distribution by intensity, volume, and number of PET held at 110 C for 14 days. The size-number distribution shows the greatest number of particles found in solution had a size of 70nm. This is in the size range of a nano plastic, meaning after 14 days PET degrades into mainly nano plastics. The size-volume and size-intensity distributions showed that while most particles had a size of around 70 nm, those particles did not take up the most volume in solution. This is because the largest peak on the center graph was around 900 nm. Particles of this size were both large and numerous enough to take up the highest amount of total volume of solution compared to particles of other sizes.
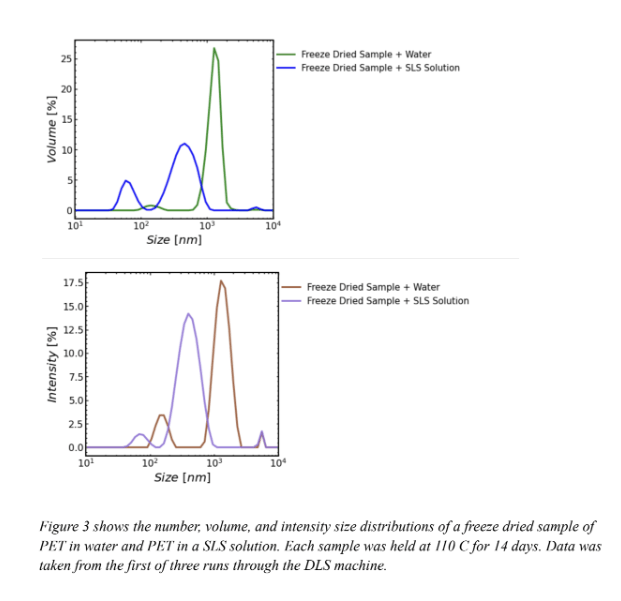
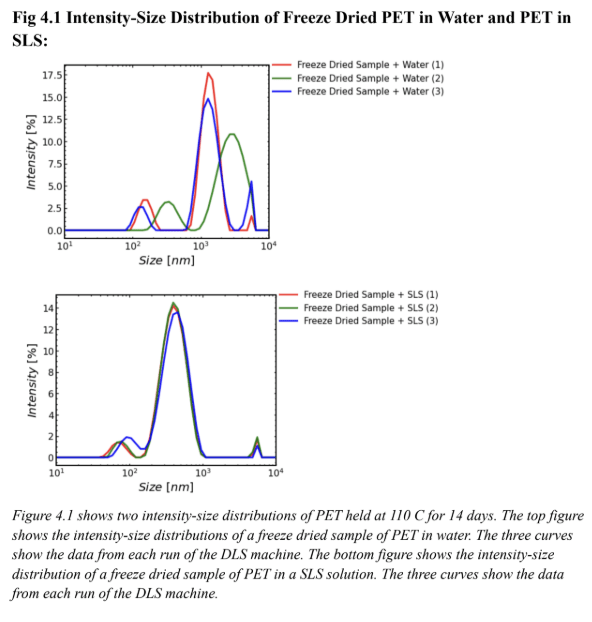
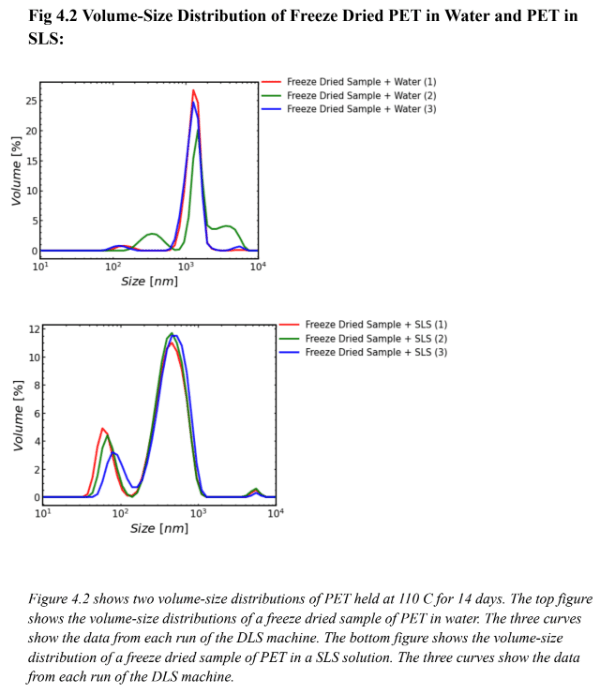
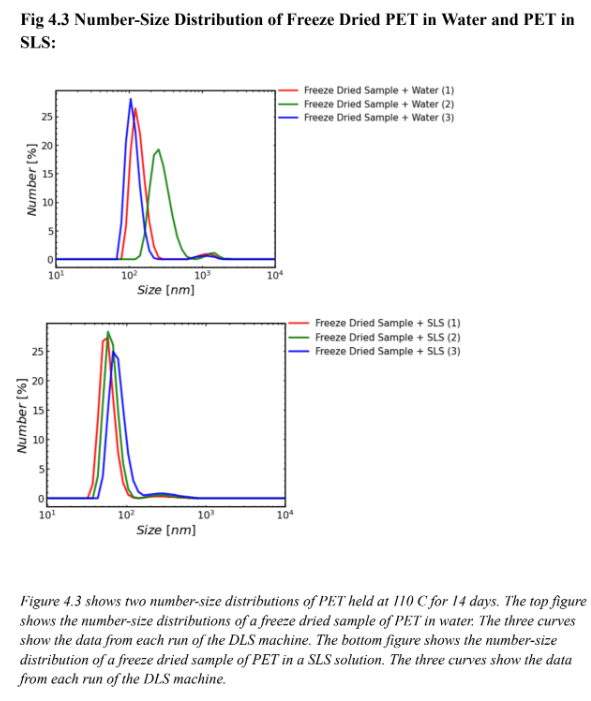
Figure 3 shows the number, volume, and intensity size distribution of PET in water and PET in a SLS solution. Figure 3 demonstrates the effectiveness of SLS on particle suspension. In the volume size distribution, the singular curve on the freeze dried sample in water graph (green) is misleading because it implies that the particles that take up the most volume in solution are the particles around 103 nm. The SLS curve (blue) shows that this is false. because it reveals two peaks on the SLS graph each with smaller sized particles than that on the water graph. Since the SLS graph had two peaks and the water graph only had one, in the water solution smaller particles likely aggregated with larger particles thus creating apparently larger particles. This is evidence that SLS is useful for particle suspension because the two peaks demonstrate a separation of the aggregated particles measured in the water graph. SLS helps differentiate the size classes of particles by keeping the majority of particles separate from one another in suspension. The intensity distribution also supports the effectiveness of SLS. On the intensity distribution (bottom graph) the freeze dried sample in SLS curve is shifted to the left of the freeze dried sample in water. This supports the hypothesis that the freeze dried sample in water curve shows aggregates of particles forming seemingly larger particles. The number distribution (top graph) also supports this hypothesis. Since the SLS curve peaks at a lower number than the water curve, the water curve likely also shows aggregates of particles clumped together forming seemingly larger sizes.
Figure 4.1 supports the effectiveness of SLS for particle suspension. Since the DLS machine took three runs a common issue in this experiment was the fact that the plastic would settle over time in the machine. The runs in the top graph of Figure 4.1 show data that are offset from each other, likely because in water the particles settled over time. The same effect is not apparent for the runs on the SLS solution. In the top graph of Fig 4.1 (the water sample), the red curve (run 1) green curve (run 2) and blue curve (run 3) were all spaced apart so there was likely movement of particles through all three DLS runs. The bottom graph in Figure 4.1 (the SLS sample) depicts curves that are almost perfectly stacked on top of one another. This is likely because there was less particle movement in three runs of the DLS machine. It can be inferred that the particles were suspended and did not settle over time. Figures 4.2 and 4.3 support the same hypothesis that SLS was effective for particle suspension. Figure 4.2 is the volume-size distribution, and similarly to Figure 4.1 the three curves on the bottom graph (SLS graph) are closer together than the three curves on the top graph (water graph). This also likely shows that there was less particle movement in the runs using SLS rather than water meaning SLS was effective for particle suspension. Figure 4.3 is a number-size distribution and also supports the hypothesis. Because the three curves in the bottom graph (SLS graph) are closer together than the three curves on the top graph (water graph) there was likely less particle movement meaning SLS was effective for particle suspension. It is important to note that on Figures 4.1, 4.2, and 4.3 the three curves on each SLS graph were not perfectly aligned. This shows that while SLS was effective for particle suspension it is not perfect and it is likely that some particles will settle over time.
As seen in images 4 and 5 the PET particles were not spherical. Since the calculations for size distribution relies on the particles being spherical one should note that the results of the size distributions are based on an estimation of particle size. The SEM and TEM images show that the PET particles likely take the shape of layers of PET rather than spheres of PET.
Conclusion:
This lab determined that when held at temperatures in water of 110 C, after 14 days PET plastic will form both nano and micro plastics. PET will begin degradation much sooner in water held at 110 C than 100 C. PET will also degrade at a faster rate when held at 110 C than 100 C. SLS is an effective surfactant for particle suspension. This lab also determined that the greatest number of particles degraded after 14 days held at 110 C were nanoplastics with a size of 70nm.
The findings of this lab can be used to improve studies on microplastics in the future.
Samples of PET held at 110 C for 14 days can be used to produce a stock amount of nanoplastics as they may occur in nature. These can be sent to other laboratories with projects specializing in nano and microplastic research. If it is determined that degradation of PET is better for the environment than leaving PET as large waste, the findings of this lab show that PET can be successfully and quickly degraded at 110 C. Since SLS was shown to be a successful means of particle suspension, perhaps it could be used to remove micro and nanoparticles from solution.
Since the error of particles settling in solution was not remedied until Day 14, if one is trying to replicate the results of this experiment, then one should use SLS for particle suspension from Day 0. Future experiments may want to explore the smallest possible size of particles SLS can suspend and perhaps determine a size range where SLS is effective.
The lack of research on the effects of nanoplastics on humans and the environment can be attributed to the difficulty with which nanoplastics are controlled in an experimental setting. SLS may be a helpful tool in the future of nanoplastic research because it can be used to control nanoplastics in solution by suspension. This experiment is a key stepping stone in answering the question, is rapidly degrading plastic better than plastic which is left largely whole in landfills?
Future research in the field of plastic degradation is crucial to understanding the impacts of plastic waste on the environment and human health.
Acknowledgements:
I would like to acknowledge Sanat Kumar for letting me work at his polymer research lab at Columbia University. I would also like to acknowledge Nico Mendez, the graduate student who mentored me over the summer. He was extremely helpful with teaching me about the lab project, helping me understand difficult scientific concepts, and aiding me in programming the graphs presented in this paper. Finally I would like to acknowledge Mr. Waldman for helping me edit this paper every week.
Literature Cited:
Brewer, A., Dror, I., & Berkowitz, B. (2020). The mobility of plastic nanoparticles in aqueous and soil environments: A critical review. ACS ES&T Water, 1(1), 48-57. https://doi.org/10.1021/acsestwater.0c00130
Chapter 6. morphology of semicrystalline polymers. (n.d.). https://www.eng.uc.edu/~beaucag/Classes/MorphologyofComplexMaterials/Chapter%20 61%20Swedish.pdf
Comprehensive guide on polyethylene terephthalate (PET). (n.d.). Omnexus. https://omnexus.specialchem.com/selection-guide/polyethylene-terephthalate-pet-plastic
Crystallinity. (n.d.). University of Cambridge. https://www.doitpoms.ac.uk/tlplib/polymerbasics/crystallinity.php#:~:text=Crystallinity% 20defines%20the%20degree%20of,crystallinity%20increases%20hardness%20and%20d ensity
Crystallinity. (n.d.). University of Cambridge. https://www.doitpoms.ac.uk/tlplib/polymerbasics/crystallinity.php#:~:text=Crystallinity% 20defines%20the%20degree%20of,illustrated%20in%20poly(ethene)
Demirel, B., Yaras, A., & Elcicek, H. (n.d.). Crystallization behavior of PET materials.
ResearchGate.
Derived count rate – what is it? (n.d.). Malvern Panalytical. https://www.materials-talks.com/derived-count-rate-what-is-it/
Dynamic light scattering DLS. (n.d.). LS Instruments. https://lsinstruments.ch/en/theory/dynamic-light-scattering-dls/introduction
Dynamic light scattering (DLS). (n.d.). Malvern Panalytical. https://www.malvernpanalytical.com/en/products/technology/light-scattering/dynamic-lig ht-scattering#:~:text=Dynamic%20light%20scattering%20(DLS)%2C,latest%20technolo gy%2C%20lower%20than%201nm
Dynamic light scattering (DLS) particle size distribution analysis. (n.d.). Horiba Scientific. https://www.horiba.com/int/scientific/technologies/dynamic-light-scattering-dls-particle-s ize-distribution-analysis/dynamic-light-scattering-dls-particle-size-distribution-analysis/
Glass Transition Temperature. (n.d.). Omnexus the Material Science Platform. https://omnexus.specialchem.com/polymer-property/glass-transition-temperature#:~:text
=Tg%20is%20an%20important%20feature,soft%20and%20flexible%20like%20rubber
Hiraga, K., Taniguchi, I., Yoshida, S., Kimura, Y., & Oda, K. (2019). Biodegradation of waste
PET. EMBO Reports, 20(11). https://doi.org/10.15252/embr.201949365
How is the Hydrodynamic Diameter defined? (n.d.). Dynamic Biosensors. https://www.google.com/url?q=https://www.dynamic-biosensors.com/ufaqs/how-is-the-h ydrodynamic-diameter-defined/%23:~:text%3DThe%2520hydrodynamic%2520diameter
%2520&sa=D&source=docs&ust=1705723399801486&usg=AOvVaw1Af4LFPJhlSUaY OiJvEh9J
Introduction to dynamic light scattering (DLS). (n.d.). Microtrac MRB. https://www.microtrac.com/products/particle-size-shape-analysis/dynamic-light-scatterin g/#:~:text=Introduction%20to%20Dynamic%20Light%20Scattering%20(DLS)&text=Dy namic%20light%20scattering%20enables%20the,0.3%20nm%20to%2010000%20nm
An introduction to PET (polyethylene terepthalate). (n.d.). PETRA.
https://petresin.org/an-introduction-to-pet/#:~:text=Virtually%20all%20single%2Dservin g%20and,window%20cleaner%2C%20even%20tennis%20balls
Ioakeimidis, C., Fotopoulou, K. N., Karapanagioti, H. K., Geraga, M., Zeri, C., Papathanassiou, E., Galgani, F., & Papatheodorou, G. (2016). The degradation potential of PET bottles in the marine environment: An atr-ftir based approach. Scientific Reports, 6(1). https://doi.org/10.1038/srep23501
Jog, J. P. (1995). Crystallization of polyethyleneterephthalate. Journal of Macromolecular Science, Part C: Polymer Reviews, 35(3), 531-553. https://doi.org/10.1080/15321799508014598
Kauffer, Z., & May, P. (n.d.). Sodium lauryl sulfate. Molecule of the Month March 2010. https://www.chm.bris.ac.uk/motm/SLS/SLSh.htm#:~:text=Sodium%20lauryl%20sulfate
%20is%20a,is%20hydrophobic%20and%20water%20insoluble
Key parameters when using dynamic light scattering. (n.d.). AZO Materials. https://www.azom.com/article.aspx?ArticleID=16772#:~:text=The%20number%20distrib ution%20demonstrates%20the,in%20the%20different%20size%20bins
Lai, H., Liu, X., & Qu, M. (2022). Nanoplastics and human health: Hazard identification and biointerface. Nanomaterials, 12(8), 1298. https://doi.org/10.3390/nano12081298
Lai, H., Liu, X., & Qu, M. (2022). Nanoplastics and human health: Hazard identification and biointerface. Nanomaterials, 12(8), 1298. https://doi.org/10.3390/nano12081298
Mattsson, K., Johnson, E. V., Malmendal, A., Linse, S., Hansson, L.-A., & Cedervall, T. (2017).
Brain damage and behavioural disorders in fish induced by plastic nanoparticles delivered through the food chain. Scientific Reports, 7(1). https://doi.org/10.1038/s41598-017-10813-0
Maurya, A., Bhattacharya, A., & Khare, S. K. (2020). Enzymatic remediation of polyethylene terephthalate (PET)–Based polymers for effective management of plastic wastes: An overview.
Frontiers in Bioengineering and Biotechnology, 8. https://doi.org/10.3389/fbioe.2020.602325
Panalytical, M. (n.d.). A basic introduction to dynamic light scattering (DLS) for particle size analysis [Video]. YouTube. https://youtube.com/watch?v=FaQM7C4oTz0
Panalytical, M. (n.d.). Introduction to dynamic light scattering analysis [Video]. YouTube. https://www.youtube.com/watch?v=ET6S03GeMKE
Polyethylene terephthalate. (n.d.). Royal Society of Chemistry.
https://edu.rsc.org/magnificent-molecules/polyethylene-terephthalate/2500258.article#:~:t ext=To%20produce%20PET%2C%20chemists%20use,terephthalic%20acid%20and%20 ethylene%20glycol
Researchers engineer microorganisms to tackle PET plastic pollution. (n.d.). National Renewable Energy Laboratory (NREL).
https://www.nrel.gov/news/program/2021/researchers-engineer-microorganisms-to-tackle
-pet-plastic-pollution.html
Sample preparation in TEM. (n.d.). News Medical Life Sciences.
https://www.news-medical.net/life-sciences/Sample-Preparation-in-TEM.aspx
Scanning electron microscope. (n.d.). Purdue University. https://www.purdue.edu/ehps/rem/laboratory/equipment%20safety/Research%20Equipment/sem.html#:~:text=The%20SEM%20is%20an%20instrument,is%20held%20within%2 0a%20vacuum
Sharma, V. K., Ma, X., Lichtfouse, E., & Robert, D. (2022). Nanoplastics are potentially more dangerous than microplastics. Environmental Chemistry Letters, 21(4), 1933-1936. https://doi.org/10.1007/s10311-022-01539-1
Sodium Lauryl Sulfate. (n.d.). The American Cleaning Institute. https://www.cleaninginstitute.org/industry-priorities/policy/other-issues/sodium-lauryl-su lfate-sls#:~:text=What%20Is%20SLS%3F,remove%20oily%20stains%20and%20residue s
Stanica-Ezeanu, D., & Matei, D. (2021). Natural depolymerization of waste poly(ethylene terephthalate) by neutral hydrolysis in marine water. Scientific Reports, 11(1). https://doi.org/10.1038/s41598-021-83659-2
Steimel, J. P., Dr. (n.d.). Lecture 9: Amorphous and semi-crystalline polymers: Glass transition temperature [Video]. https://www.youtube.com/watch?v=o5UGQpPMScw
Thomsen, T. B., Hunt, C. J., & Meyer, A. S. (2022). Influence of substrate crystallinity and glass transition temperature on enzymatic degradation of polyethylene terephthalate (PET).
New Biotechnology, 69, 28-35. https://doi.org/10.1016/j.nbt.2022.02.006
Toda, A. (2013). Spherulitic growth in crystalline polymers. Encyclopedia of Polymers and Composites, 1-12. https://doi.org/10.1007/978-3-642-37179-0_24-1
The transmission electron microscope. (n.d.). University of California, Santa Barbara. https://ccber.ucsb.edu/ucsb-natural-history-collections-botanical-plant-anatomy/transmiss ion-electron-microscope
Transmission electron microscopy vs scanning electron microscopy. (n.d.). Thermo Fisher Scientific.
https://www.thermofisher.com/us/en/home/materials-science/learning-center/applications/ sem-tem-difference.html#:~:text=SEMs%20usually%20use%20acceleration%20voltages, to%201%E2%80%932%20million%20times
2.1: Brownian motion: evidence for Atoms. (n.d.). LibreTextsChemistry. https://chem.libretexts.org/Courses/Sacramento_City_College/SCC%3A_Chem_400_-_G eneral_Chemistry_I/Text/02%3A_Atoms_and_ElementsEdit_section/2.1%3A_Brownian
_Motion%3A_Evidence_for_Atoms
Weckhuysen, B., Have, I. T., Meirer, F., Oord, R., Zettler, E., Sebille, E. Van, & Amaral-Zettler,
L. (2021). Nanoscale infrared spectroscopy reveals nanoplastics at 5000 m depth in the south atlantic ocean. Research Square. https://doi.org/10.21203/rs.3.rs-955379/v1 Preprint, not yet peer reviewed
What is PET plastic? (n.d.). The Plastic Bottle Co. https://www.theplasticbottlescompany.com/plastic-types/pet-plastic/
Yee, M. S.-L., Hii, L.-W., Looi, C. K., Lim, W.-M., Wong, S.-F., Kok, Y.-Y., Tan, B.-K., Wong,
C.-Y., & Leong, C.-O. (2021). Impact of microplastics and nanoplastics on human health.
Nanomaterials, 11(2), 496. https://doi.org/10.3390/nano11020496


Leave a comment